New Device Deployed on Hurricane Island Experimental Aquaculture Site
Written by Lucy Williams

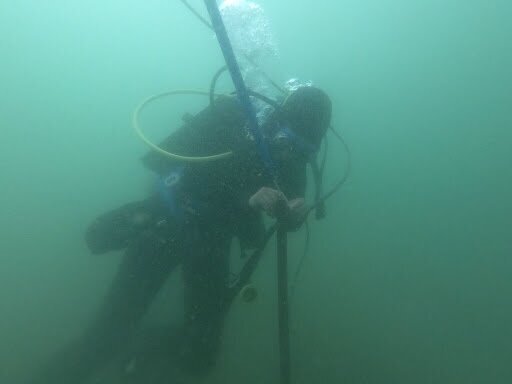
Figure 1: TCM Deployed on the bottom of our aquaculture site
There is a new data collection device on the Hurricane Island aquaculture site! This summer, the research team acquired a new device for measuring flow speed and direction called a Tilt-Current Meter, or TCM, made by Lowell Instruments, LLC. The TCM measures flow speed and direction using “drag-tilt principle.” Drag from fluid flowing over the TCM tilts the logger in the direction of the flow. This tilt is measured by the accelerometer and magnetometer in the device. The amount of tilt and direction of tilt are recorded at discrete intervals and this data can be converted into flow speed and direction. TCMs are used all over the globe for measuring flow magnitude of sites for shark research in South Africa, under sea ice in Greenland, in underwater cave systems in Yucatan, and much more. Find out more about other applications here: (https://lowellinstruments.com/applications/)

Figure 2: Plot of near-bottom flow velocity magnitude data collected at the Hurricane Island Aquaculture Site
On Hurricane Island, our research interests are concerned with scallops, and in particular, scallop spawning. Scallops are called broadcast spawners, meaning they release their gametes (eggs and sperm) into the water and hope they find each other to fertilize the egg and develop into larvae. Understanding flow speed and direction at aquaculture and wild scallop sites during the spawning season could provide valuable information about where scallop gametes and larvae go immediately after dispersal. Additionally, given that scallops are filter feeders and rely on fluid flow to feed, future growth and biological studies on our site and at wild sites could utilize the TCM. Our goal this late summer and early fall is to collect flow speed and direction data during a spawning event on our site.

Figure 3: Plot of near-surface flow velocity magnitude data collected at the Hurricane Island Aquaculture Site
Our research site is a unique location for flow due to the large tides and the ledges that protect the western and eastern edges. This summer, the research team deployed the TCM in an inverted position from our float at the aquaculture site, which provided near surface velocity data. It was also deployed in a floating position on the bottom (Fig 1). During their life on an aquaculture farm, scallops might experience many different flow speeds at different depths in the water column. Scallops kept in bottom cages (40 ft deep) might experience a different flow regime than those kept in our lantern nets, which are approximately 15 feet below the surface. Our initial deployments show us that our site has higher average flow speeds near the bottom than on the surface. The bottom deployment collected data with a maximum flow speed of 42 cm/s and minimum of 0.07 cm/s (Fig 2) whereas the near-surface deployment returned with a maximum flow speed of 13 cm/s and minimum of 0.25 cm/s (Fig 3). In an idealized, laminar system, we would expect to find slower speeds near the bottom, due to the drag of the ocean floor with higher but not significantly changing flow speeds up the water column. But, the ocean is anything but idealized. The geometry of the site, i.e. the ledges, are no doubt affecting the water flow. Additionally, this data showed us that the flow direction is stronger in the eastern-western directions (Fig 4).

Fig 4: Plot of TCM Eastern and Western Flow Speed Data for Bottom Deployment on Hurricane Island Aquaculture Site. Note, these are only components of a velocity vector and not not obviously represent the full velocity magnitude.
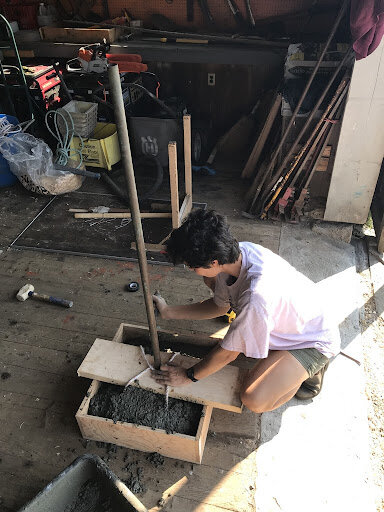
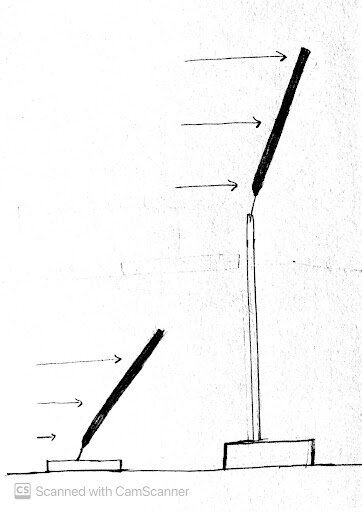
These deployments tell us what the flow is like on the near-surface and at the bottom. They do not show us what kinds of flow the scallops in the lantern nets are experiencing. The best way to do that would be to deploy the TCM at the depth of the lantern nets. However, this is impossible due to limitations of the device and the requirement for a rigid body for the provided tether to tie to. Instead, we decided to raise TCM by approximately 1 meter using a heavy rigid pole and a custom anchor (Fig 3). Essentially, we cemented the pole into a large box (Fig 4). This anchoring will hopefully catch the flow regimes further up in the water column, without catching significant bottom flow. If the flow is significantly faster in the middle of the water column, we want to know. The anchor was hauled up in our Carolina Skiff, Speed Square, and slowly lowered into our site. Then, Madison and Sam dove on the anchor to make sure it landed correctly, and tied the TCM to it (Fig 5). In a month, or longer, we will retrieve the TCM and download the data, hopefully having caught a scallop spawning event in that time!

Fig 4: Constructing the anchor for the TCM