

Post by Chloe Tremper, Science and Research Intern, Project Update
For my summer research project, I am completing a forest health assessment of the spruce-fir stand on the northern half of Hurricane Island. Forest health and how to assess it is hugely subjective depending on the forest type you’re working with and what your definition of “healthy” is. For this particular assessment I decided to focus on damage and disease within the forest, regeneration, blow down risk, and fire risk. Since little is known about Hurricane’s forests, my project aims to determine any major risks currently facing the spruce-fir stand on the island as well as recommend any needed management and improved methods of monitoring the overall forest health into the future.
In order to complete this assessment in a few short weeks by myself, I decided to collect data at 12 plots within the spruce-fir stand. Using Slocum’s Trail as the base of my 600m transect, I used a random number generator to determine 12 random distances between 0 and 600m. After each of these distances were measured out and flagged, the real fun began! At each distance in from the start of the transect, I start by flipping a coin to determine if the plot will be on the left or right side of the trail: heads means right and tails means left. After that, I roll a di to determine the distance into the stand I go from Slocum’s (1=5m, 2=25m, 3=50m, 4=75m, 5=100m, 6=150m).
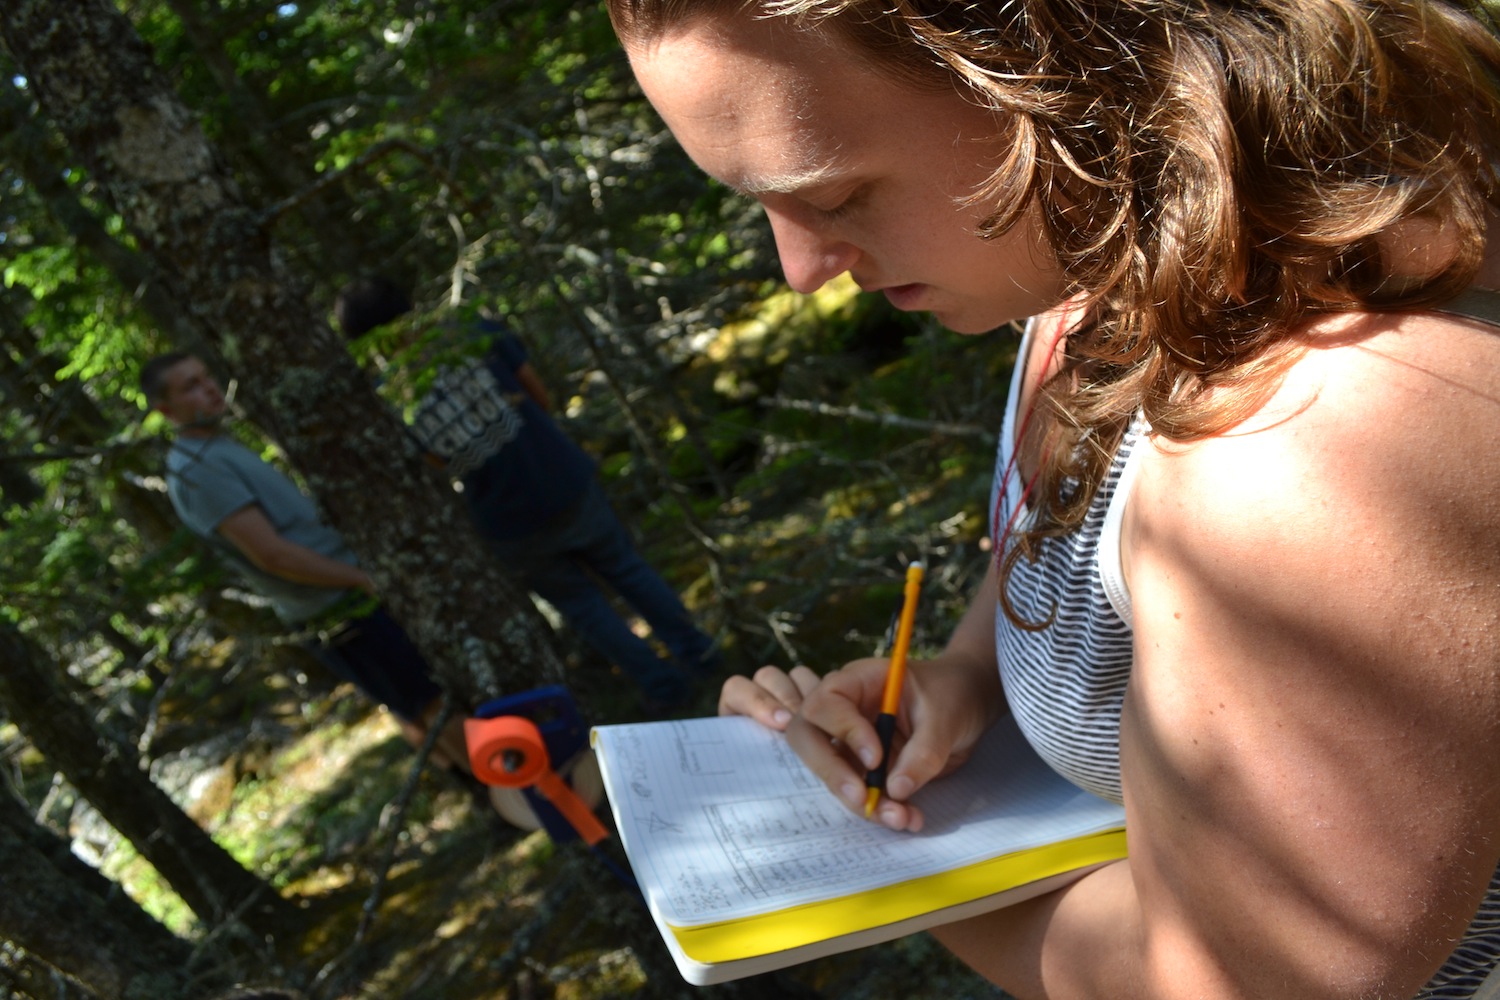
Chloe enters data with ISLE botany students recording DBH for white and red spruce trees in a plot
Once at each plot center, I set up a 5x5m square plot. Within that plot I record the species, DBH (diameter at breast height), and signs of damage/disease for each tree. I am also recording the number of 1-hour, 10-hour, 100-hour, and 1000-hour fuels. 1-hr fuels are debris less than 1/4in diameter (twigs, needles, dead grass), 10-hr are woody debris 1/4 – 1in in diameter, 100-hr are woody debris 1 - 3in in diameter, and 1,000-hr are woody debris greater than 3in in diameter. These numbers are important for estimating the risk of a fire within the stand as well as how much potential damage a fire would cause. I also tally the number of spruce saplings, fir saplings, Vaccinium spp., and other woody saplings or shrubs in order to get an idea of what would likely take over a plot if the large trees were to die back. Once all these data are recorded, I measure the soil depth in the northwest corner of each plot. Knowing the soil depth is helpful in considering the risk of blow-downs.
I am taking notes about each plot including information about the openness of the canopy, exposed bedrock, fallen trees, herbaceous cover, etc. So far, I have 8 of the 12 plots completed. I finished 3 of these plots with help from our SLE Botany students! Of the plots I have completed, I’ve noticed a lot of diversity among them, however the one thing I have seen throughout is a lot of dead woody debris which puts the island at a huge risk if there were to ever be a fire on the island. Remember, only you can prevent forest fires!
